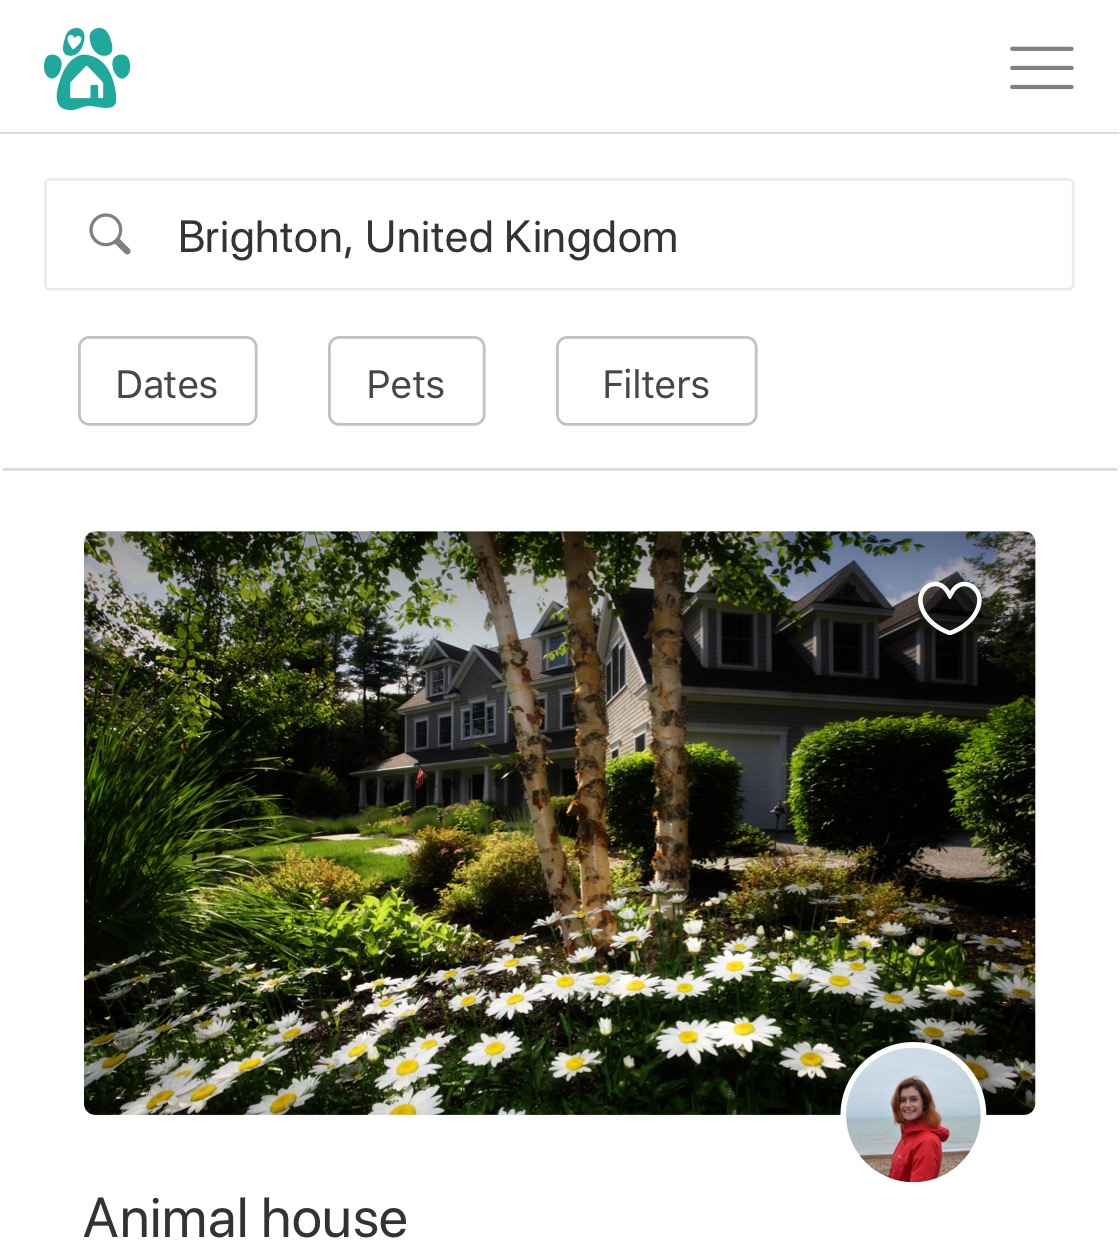
TrustedHousesitters is a house and pet sitting platform for people to look after pets in exchange for a place to stay.
Involved throughout the design sprint process focusing on:
30% of new sitters don't succeed in getting a housesit in their first three months of becoming a member leading to refunds or discontinued memberships.
Increase pet sitter success and ensure new members get a house sit in their first three months of signing up to the service.
Onboard new pet sitters helping them create quality profiles so they succeed in securing their first house sit.
We ran a Google-style design sprint to come up with and validate solutions.
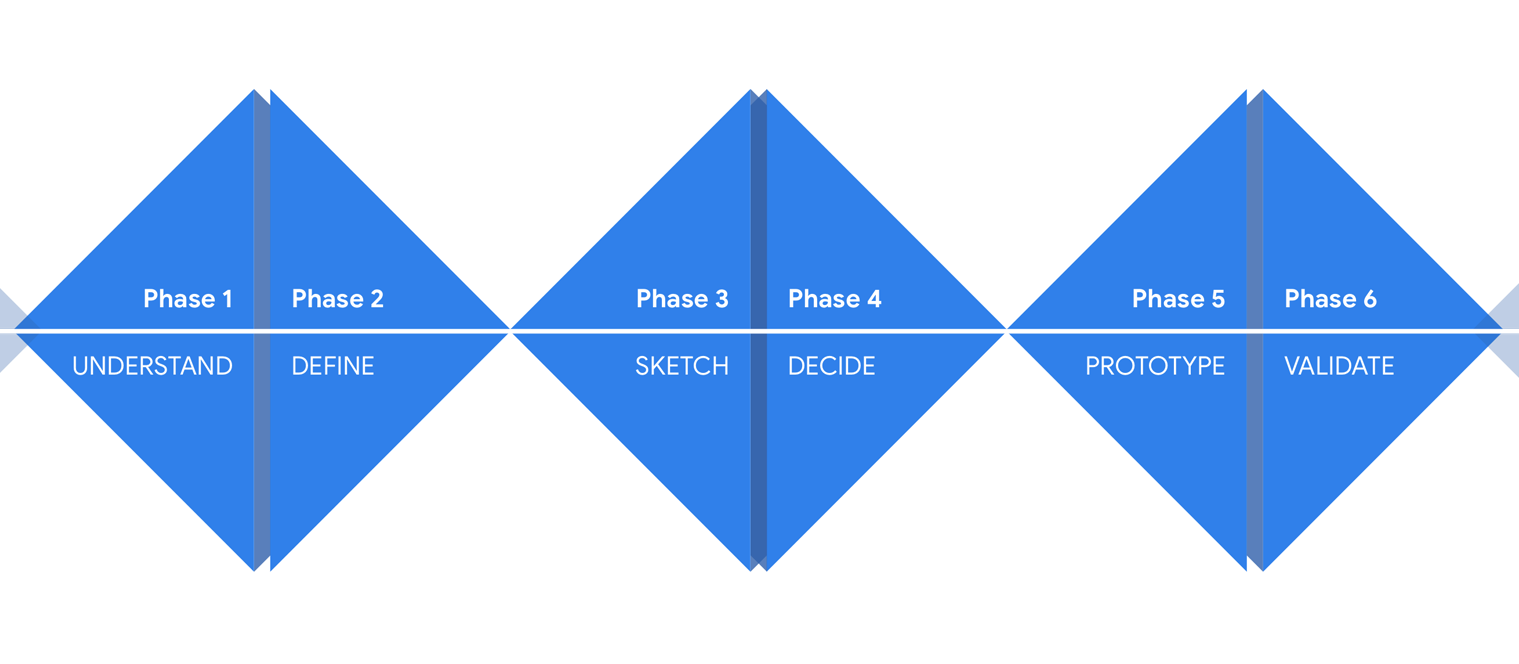
The Design Sprint is a process for solving problems through research, designing, prototyping and testing ideas with users.
The process follows six phases: Understand, Define, Sketch, Decide, Prototype, and Validate.
We met in a space for 5 consecutive days from Monday to Friday to carry out the workshop.
The Design Sprint involved eight members from across the company with different expertise:
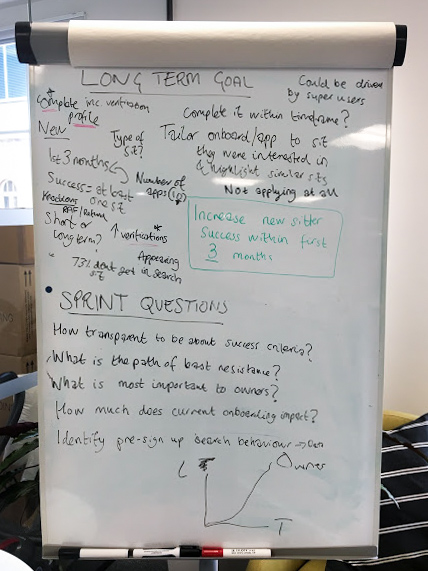
We started by determining the long-term goal of the product - where we wanted to be in the next six months.
We wanted to increase pet sitter success ensuring new members get a house sit in their first three months of signing up to the service.
Focusing on the end goal of increasing pet sitter success, we drew out a customer map involving customers and key players. The flow chart shows how users interact with the product to reach the end goal.
New users to our service would complete a profile, search for house sits and apply. One of the deciding factors of their success was understanding what homeowners looked for in prospective pet sitters.
We interviewed experts on the sprint team and from other areas of the business - asking about anything related to the journey map: the vision, how things work, and previous efforts. This information continued to inform the map and the goals.
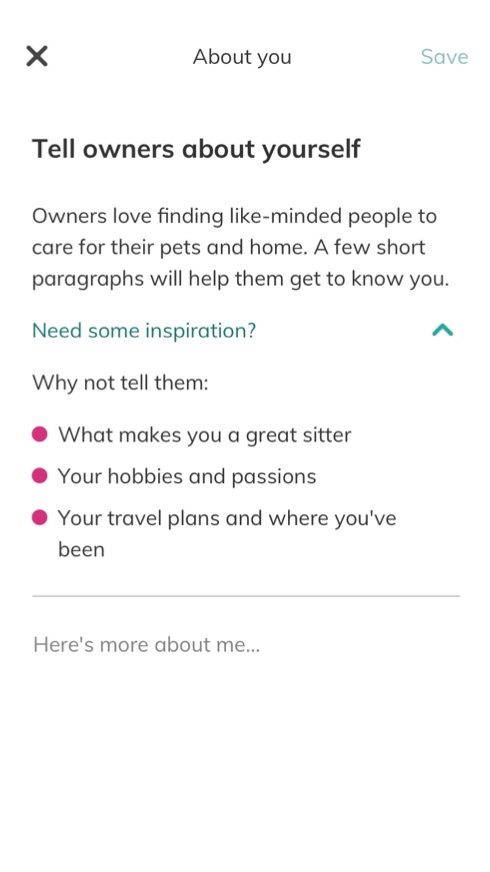
An interesting insight we heard from a customer champion informed us that new pet sitters weren't adding enough information to their profiles to be appealing to homeowners.
While experts were interviewed, each sprint member took notes on any paint points or insights they heard and positively reframed them as open-ended questions. "The How Might We" method ensures teams look for opportunities rather than jumping to solutions or get bogged down by problems.
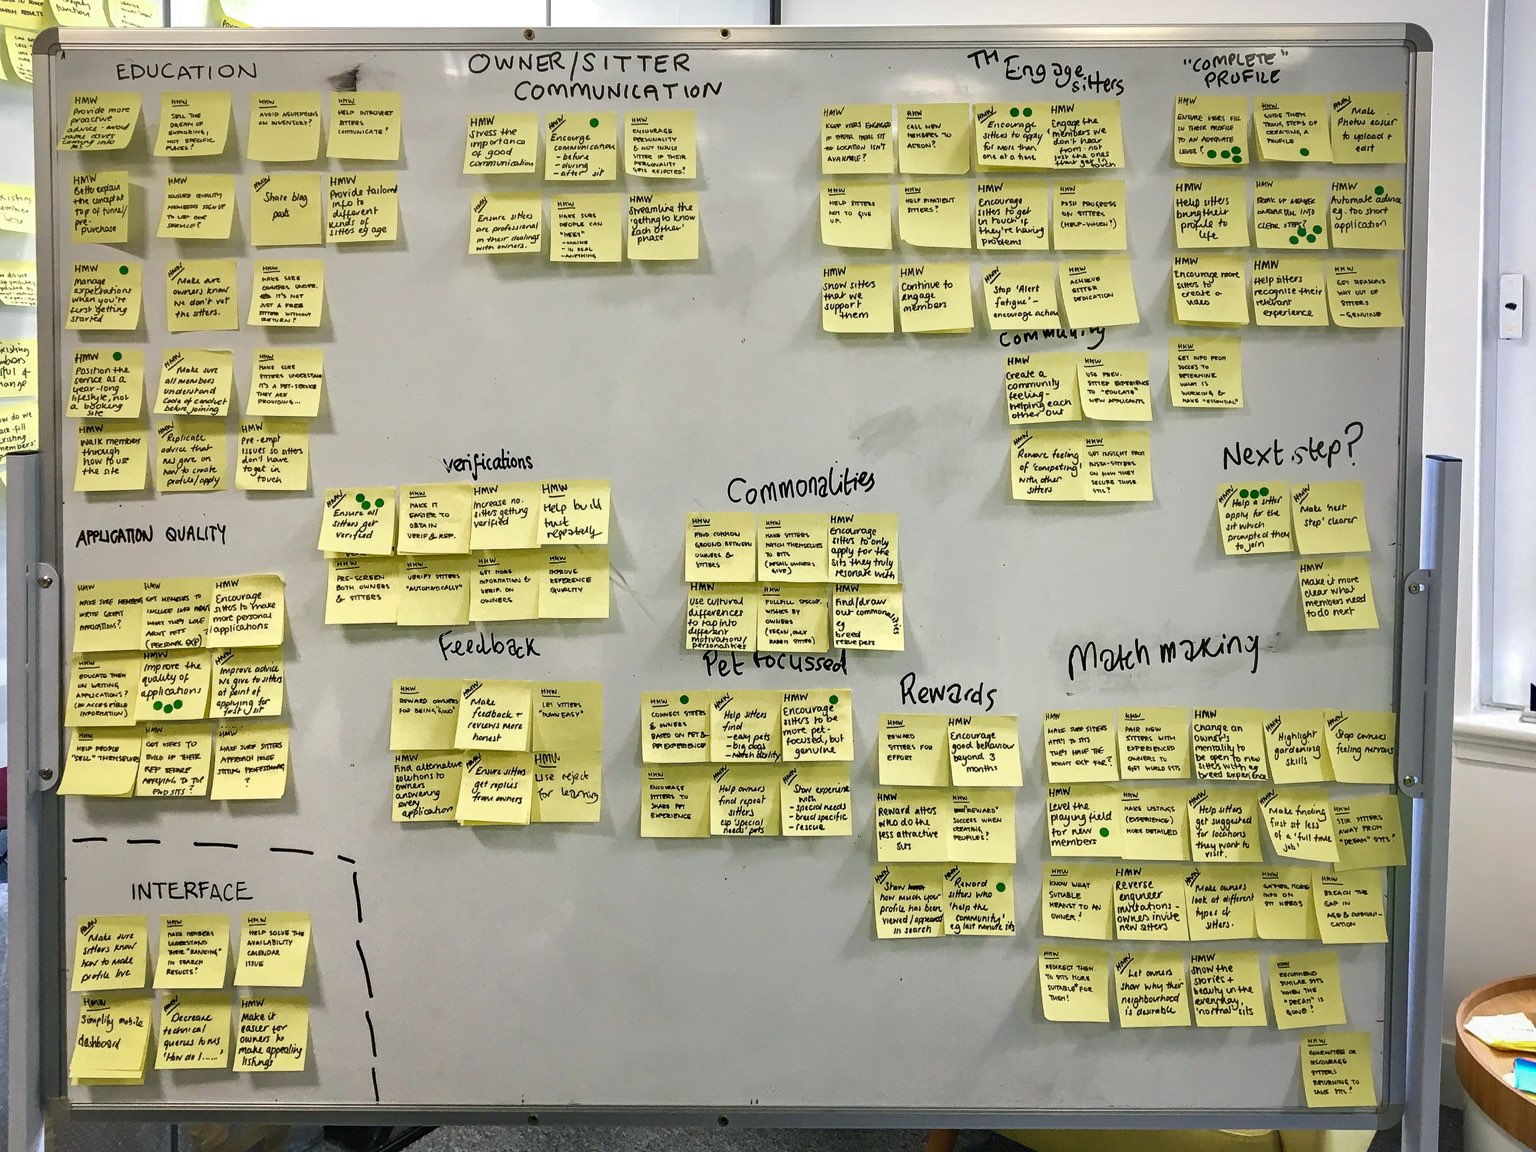
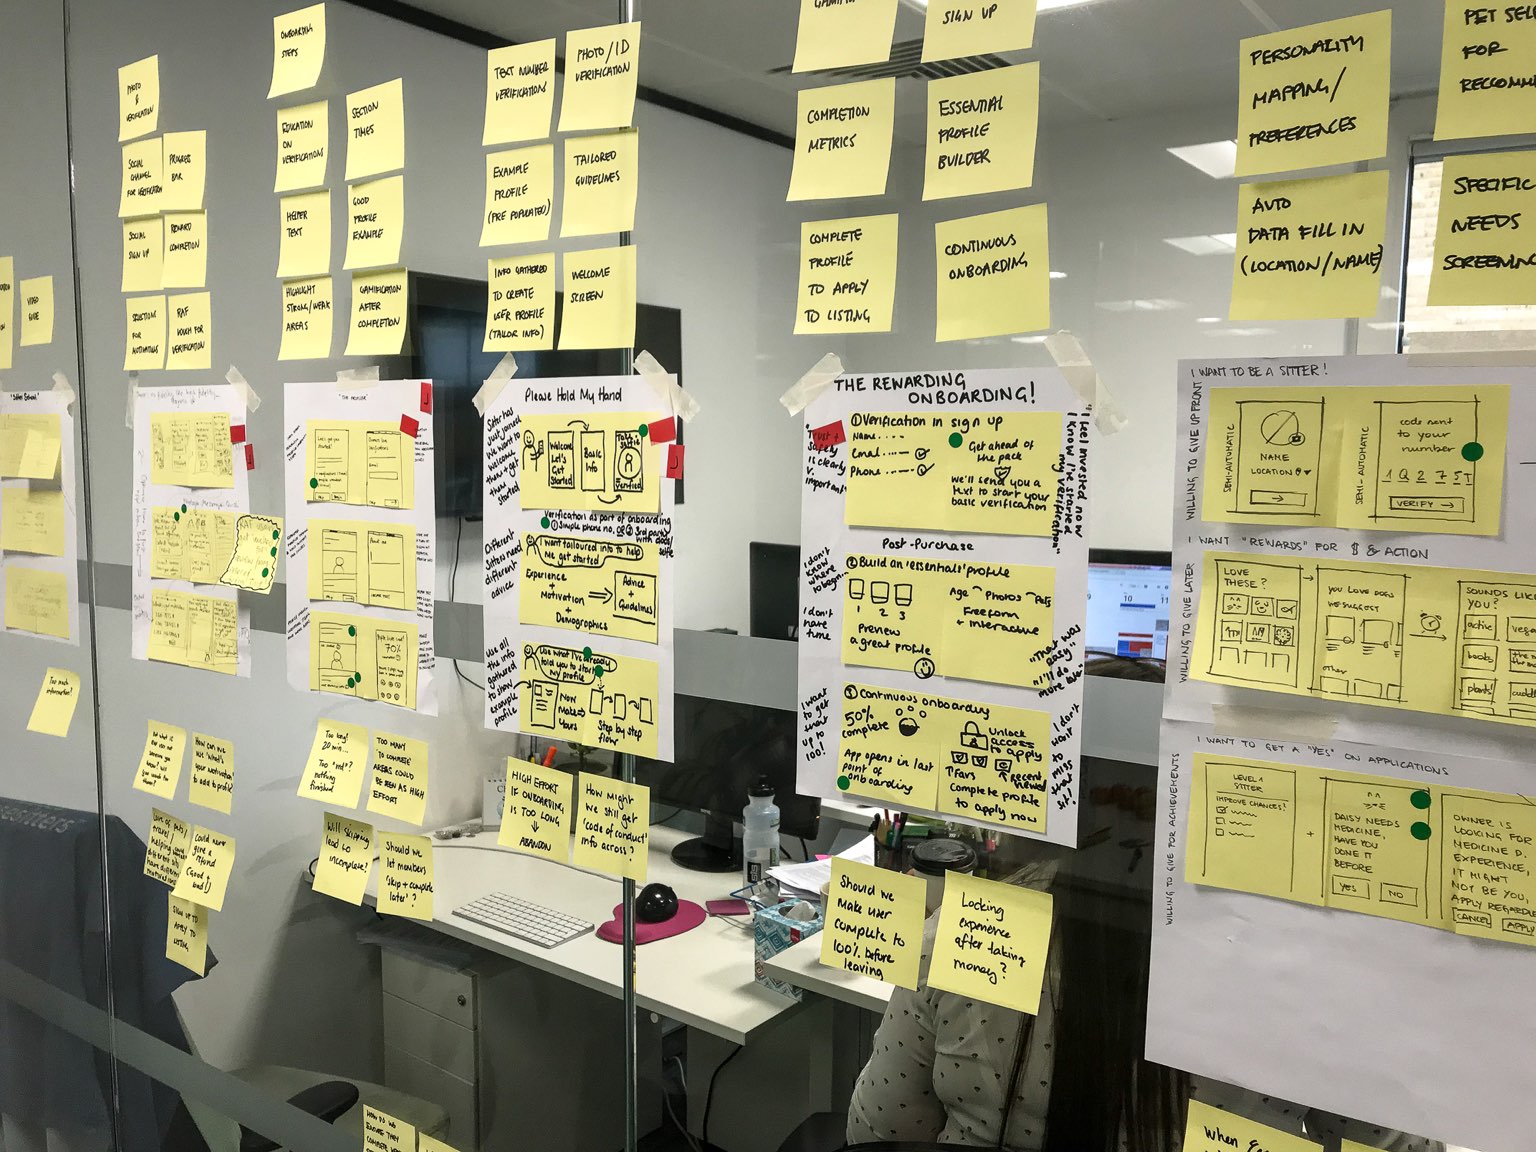
Once we finished the expert interviews, all How Might We notes were gathered and stuck onto a wall where we physically grouped them into similar themes. Each group was labelled, and notes were sorted enough to move on to prioritisation. This exercise followed Affinity Mapping.
We had 14 total groups after sorting the notes, where many opportunities were labelled under the themes of Education, Matchmaking, and Completing Profiles.
To highlight areas of emphasis to consider for the rest of the sprint, we voted on which How Might We opportunities we felt were most important. Each sprint member made two votes represented by dots they added to the sticky notes they liked.
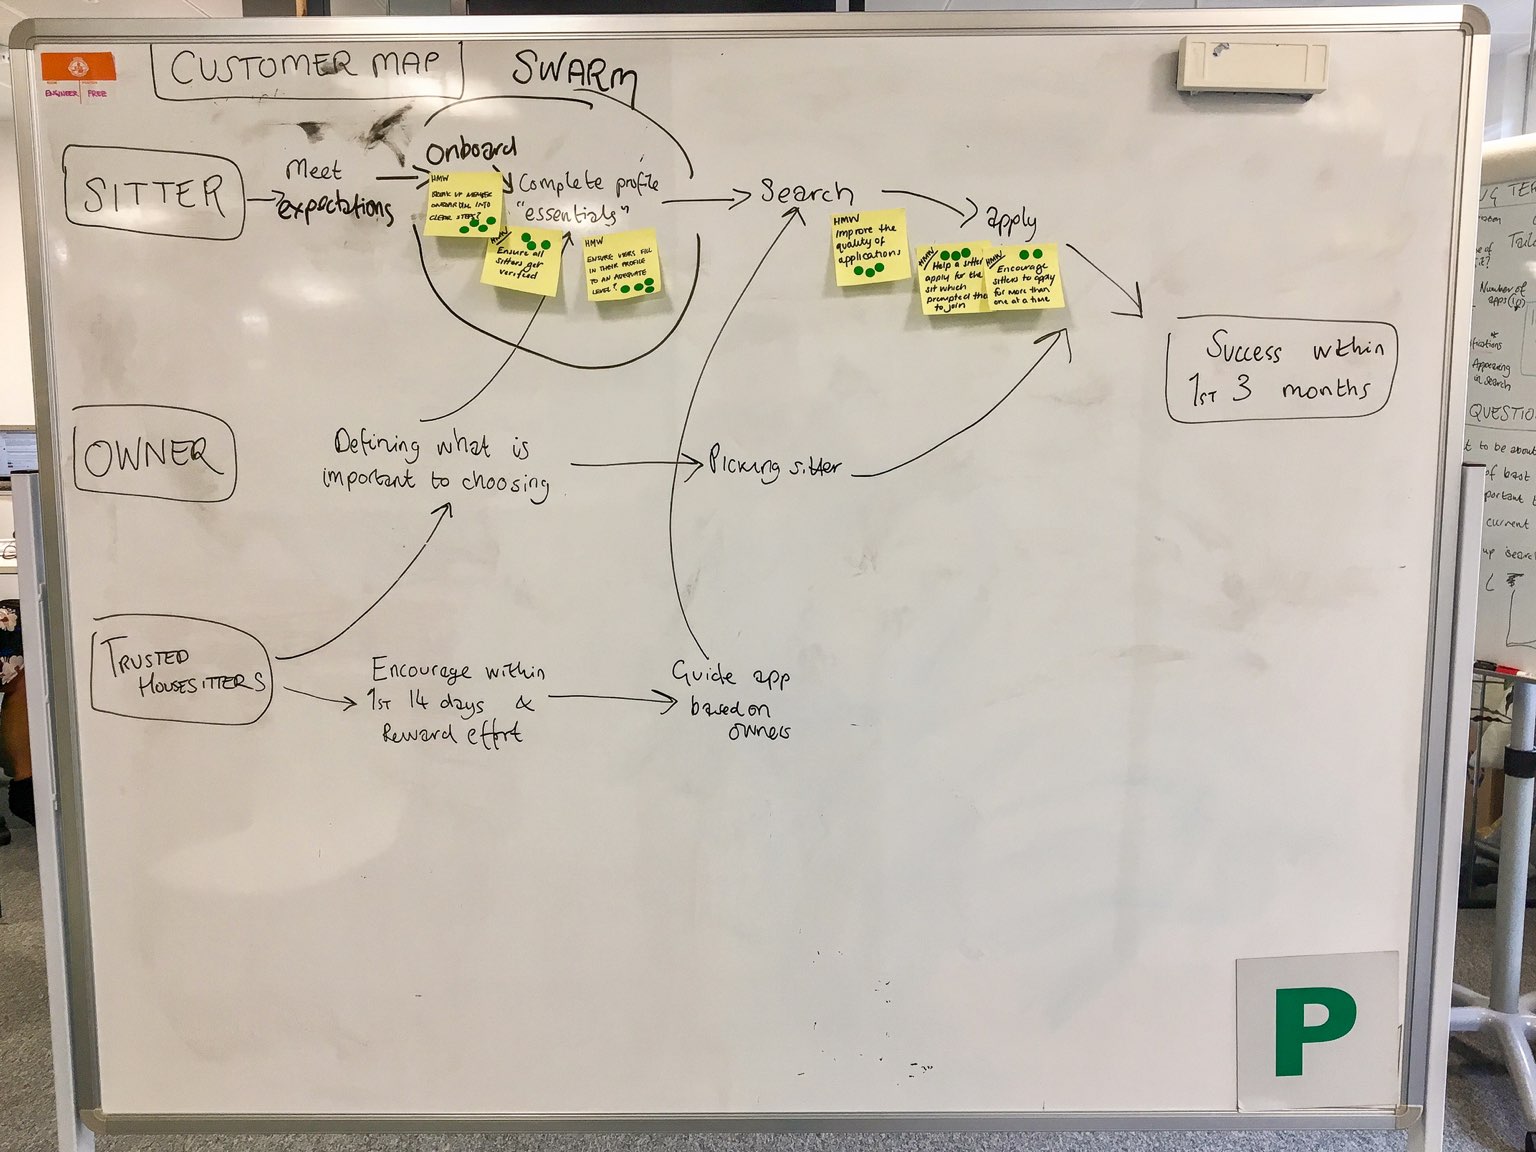
After the voting was over, we took the How Might We notes with the most votes and placed them on our map. The notes corresponded with specific areas on the map narrowing down areas of focus for the sprint. Lisa, our decider then circled the most important customer and one target moment on our map.
Pet sitters and user onboarding were chosen as the targets for our sprint.
At the end of the day we had determined our:
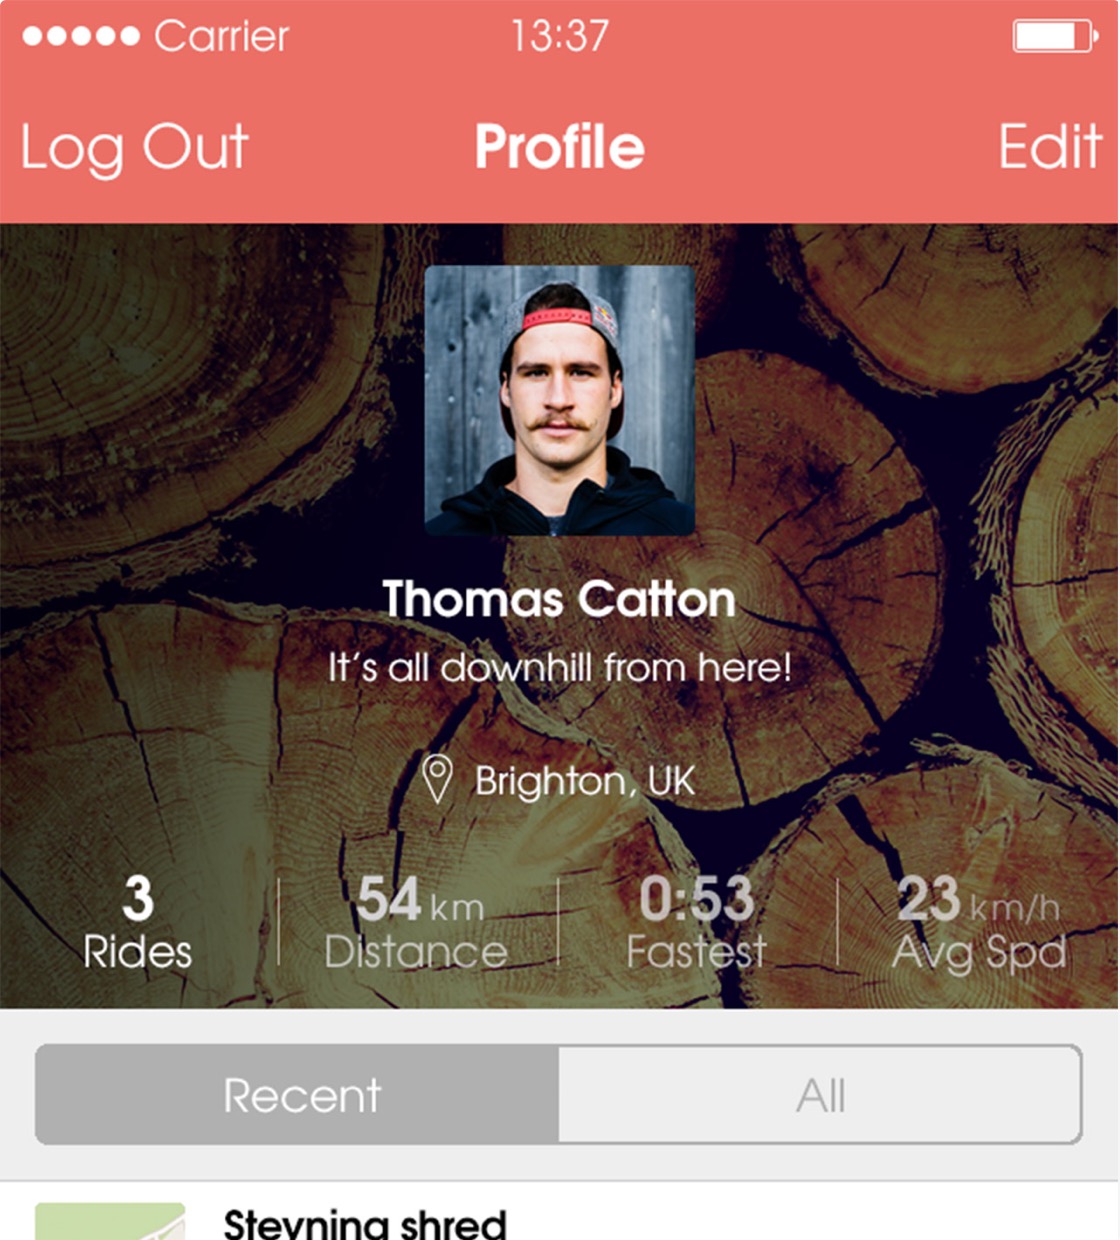
To jump-start our inspiration we spent some time looking at solutions from other products, from different domains. Each member spent 3 minutes demoing what they liked from their favourite product while the rest of the team took notes and sketched ideas.
Some products we looked at for inspiration:
Before jumping into sketching out ideas, we took some time to look at the map and decide if the target was focused enough for the team to work together on the same part of the problem or if we needed to divide the team and work of different areas.
We decided that the target was focused enough for the entire team to work together on the onboarding area.
We used a four-step sketching exercise to quickly come up with ideas for our target opportunity:
How might we ensure users fill in their profiles to an adequate level so that owners find them appealing?
We spent 20 minutes silently walking around the room and gathering notes. Note taking allowed the team to review the goals, opportunities, and inspiration collected and prepared us to translate our ideas into visual sketches.
Once everyone had reviewed all of the information and made notes, each member jotted down rough ideas on a sheet of paper. The ideas can take any shape such as doodles, headlines, sketches - anything which enables thoughts to form into ideas.
Crazy 8s allowed us to take our strongest ideas and sketch them into eight variations in just eight minutes. We started by folding a piece of paper into eight sections then sketched one idea in each panel every minute.
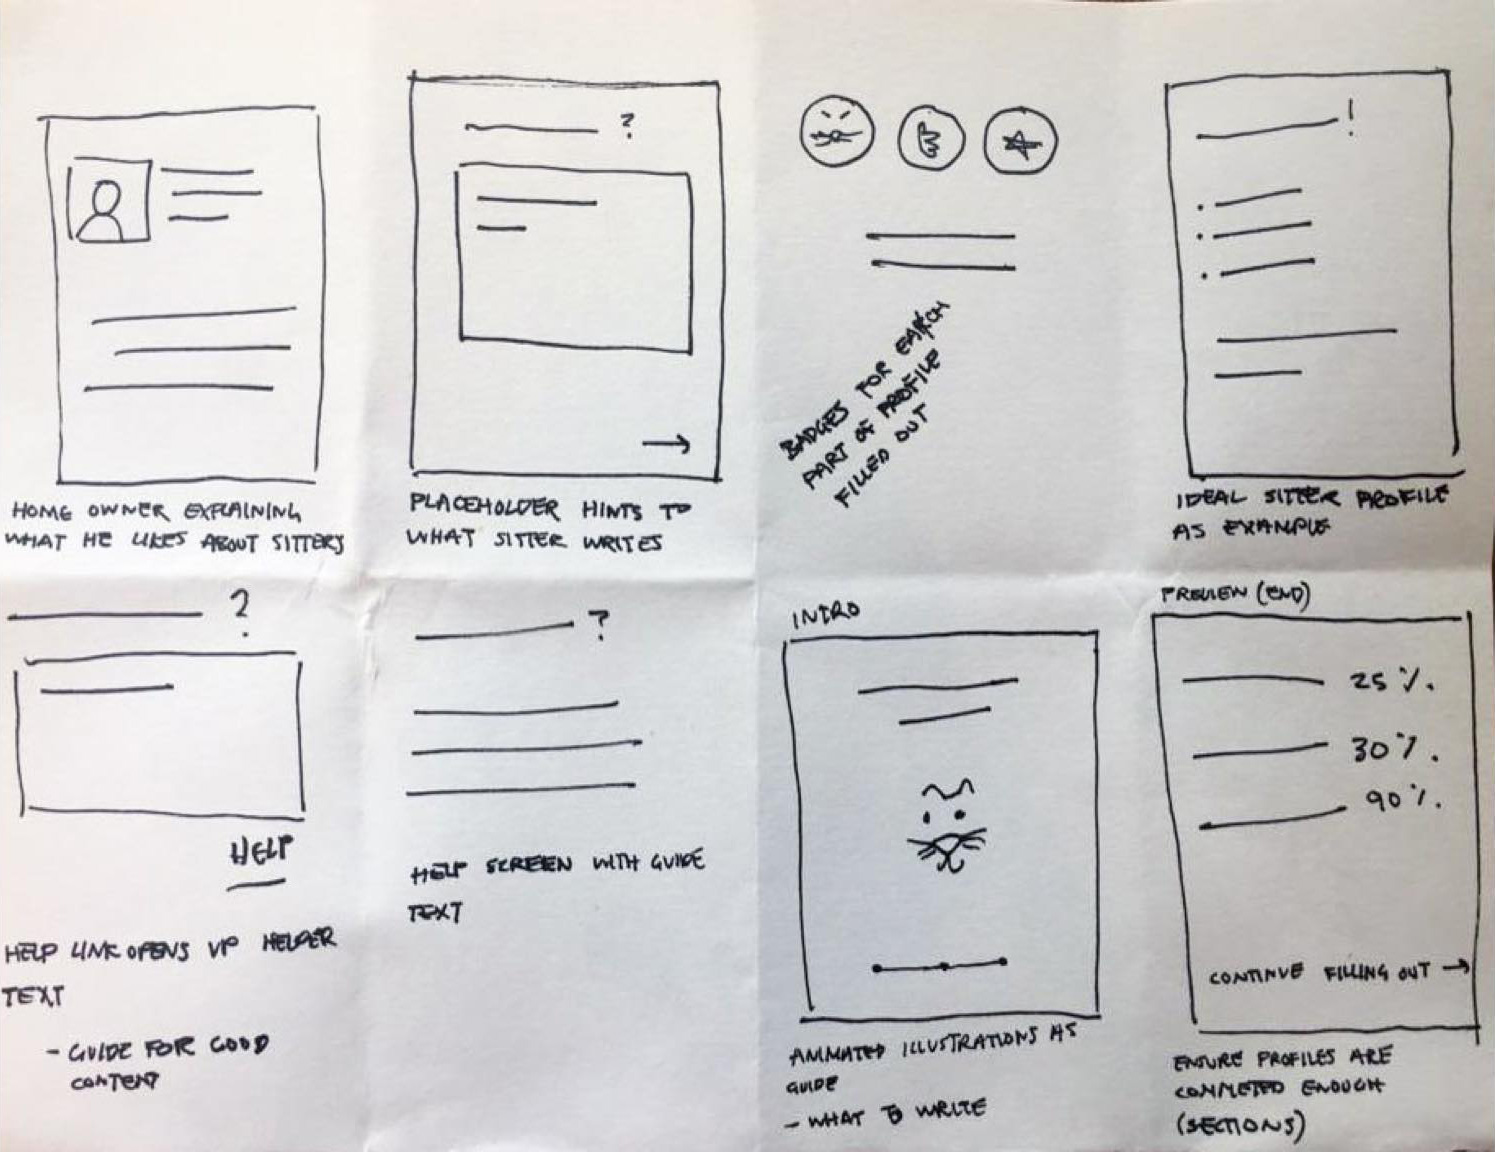
Finally, we each took our best idea for the solution and sketched it out in a three-panel storyboard format because "products and services are more like movies than snapshots."
At the end of the day we had:
We couldn't prototype and test all of our solutions - we needed one combined plan, so we followed a five-step process for deciding on the best idea.
We hung all the solution sketches on a wall so everyone could take a look at them.
Silently, we looked at a solution sketch and used sticky dots to vote on features we thought were worth prototyping.
We then spent 3 minutes per sketch discussing the highlights of each solution, taking notes on standout ideas.
To collect the group's opinions, we each silently voted on ideas we liked the most using large sticky dots.
With all the votes in place, Lisa our decider voted on three final solutions we continued to prototype and test.
As we had more than one winning solution sketch from the supervote, the whole team discussed whether to create multiple prototypes or combine them into one solution.
We decided to combine all ideas into an all-in-one solution.
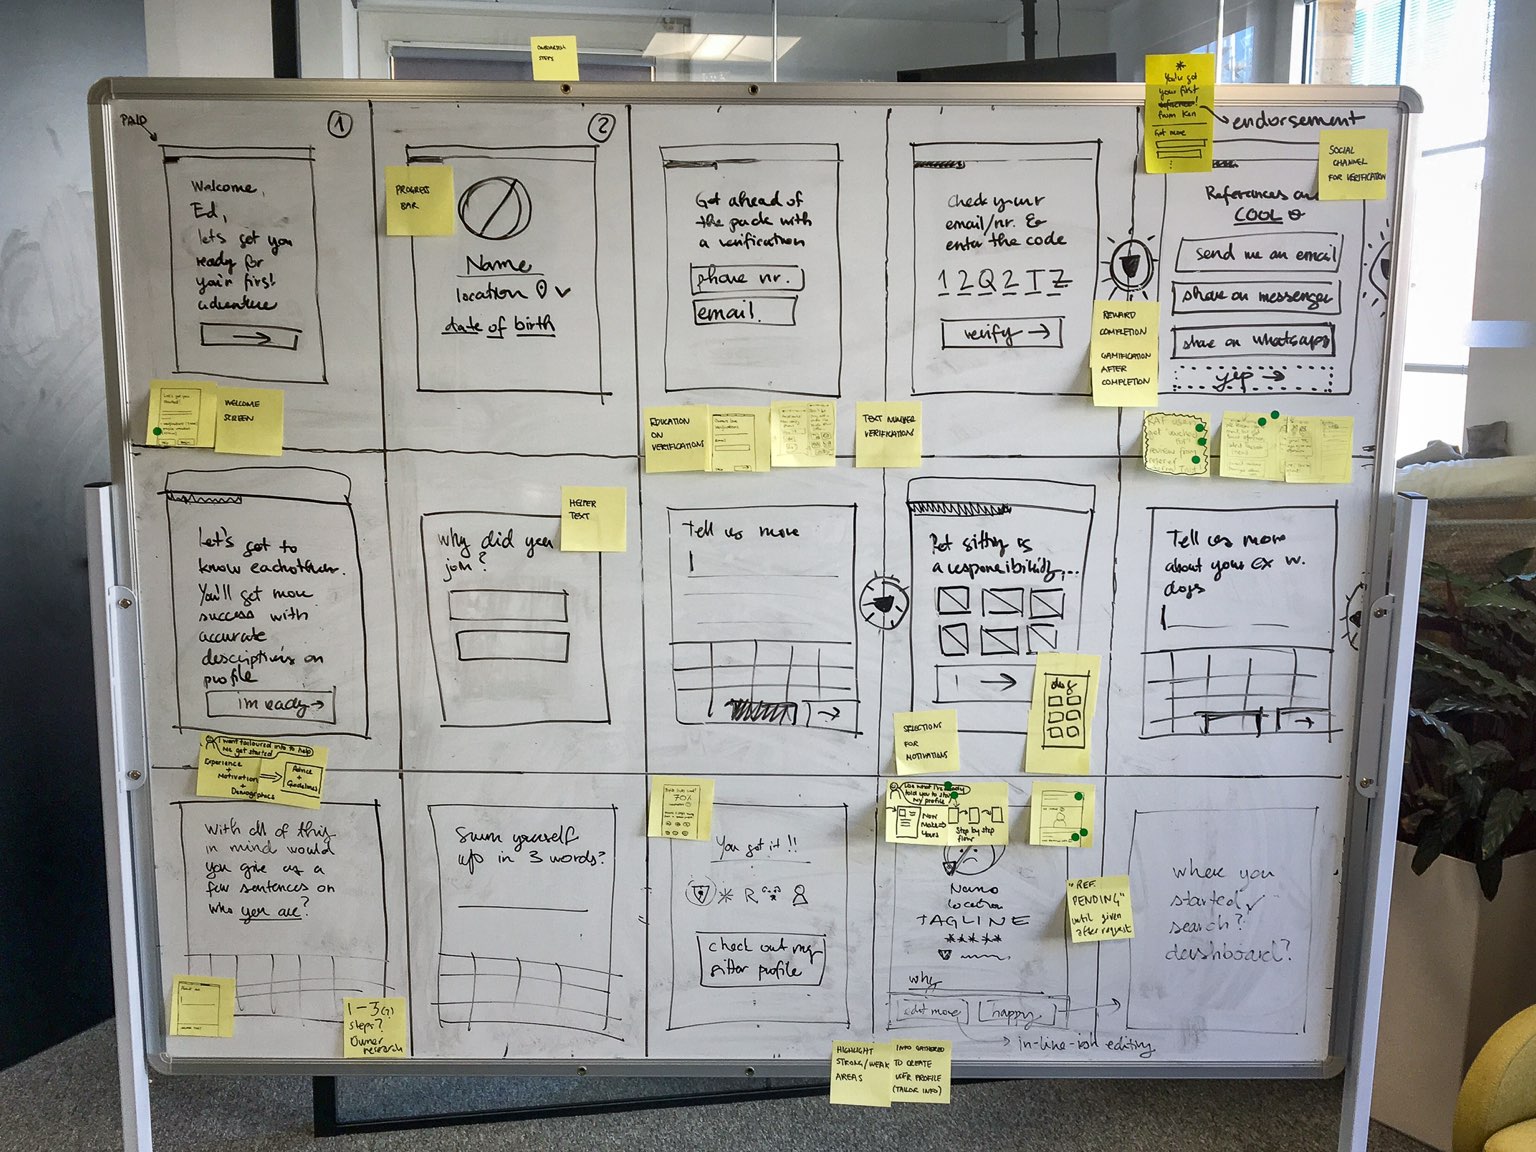
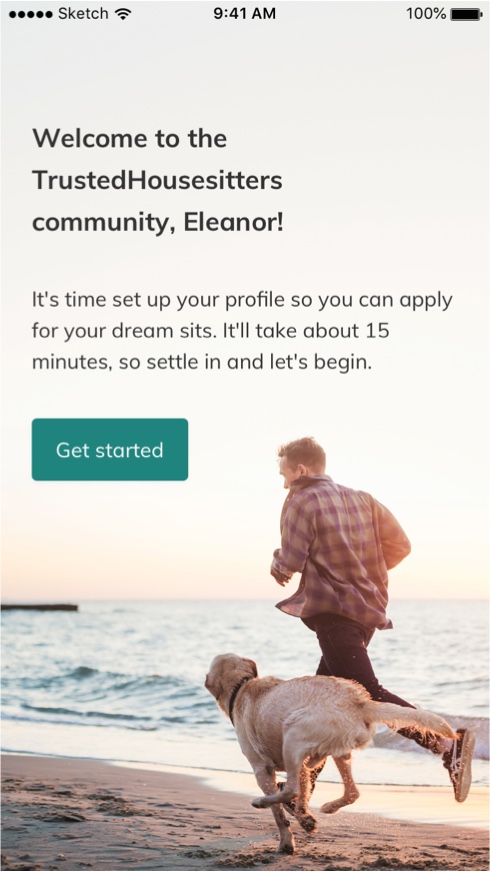
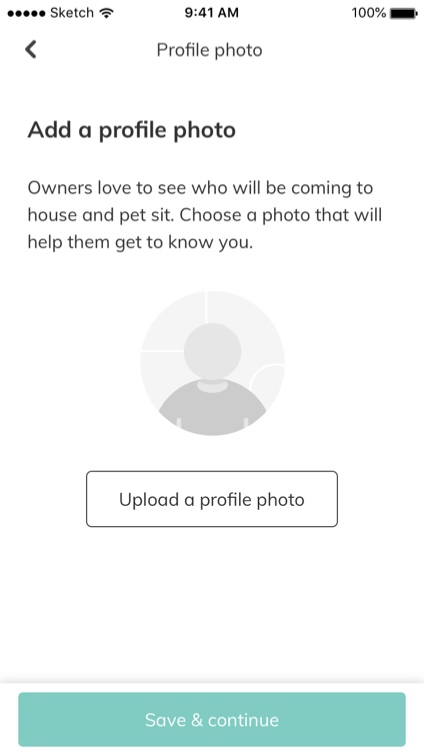
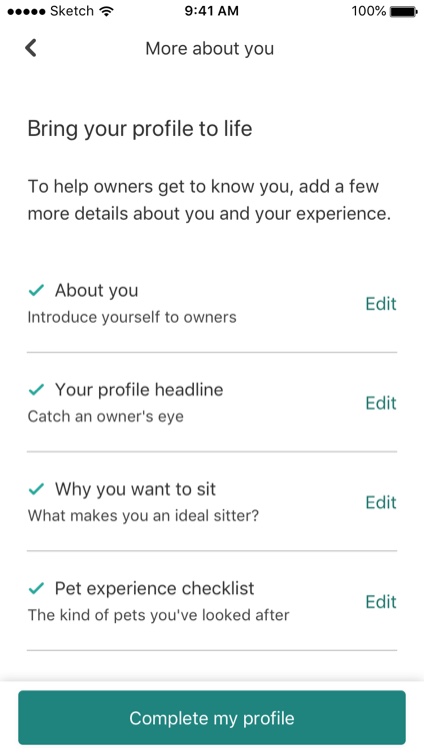
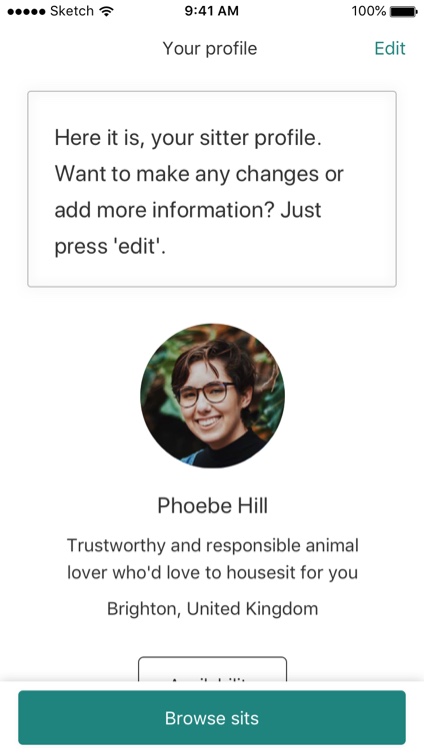
Taking the winning sketches, we strung them together into a storyboard that narrowed in on five key moments used to illustrate the solution. The flow informed the prototype and user-interview script.
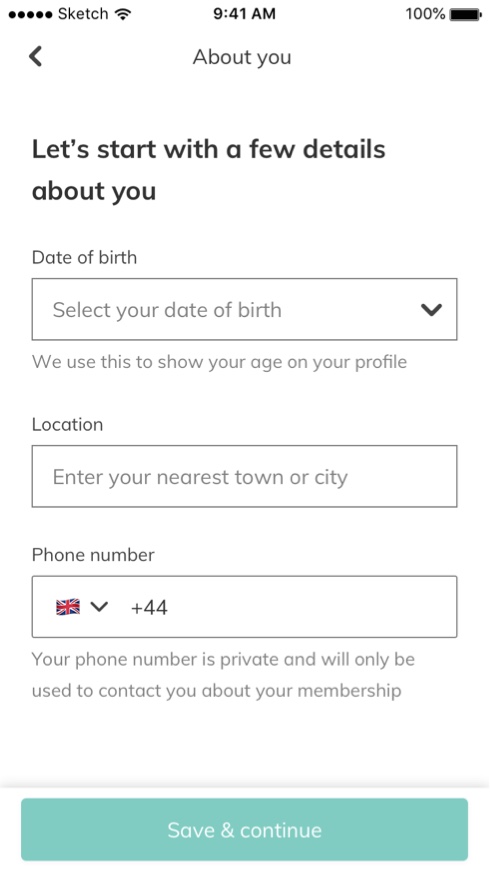
The storyboard opens with a welcome screen then guides the user through the onboarding steps involving verification, filling out personal information, pet preferences, and a profile preview.
At the end of the day we had:
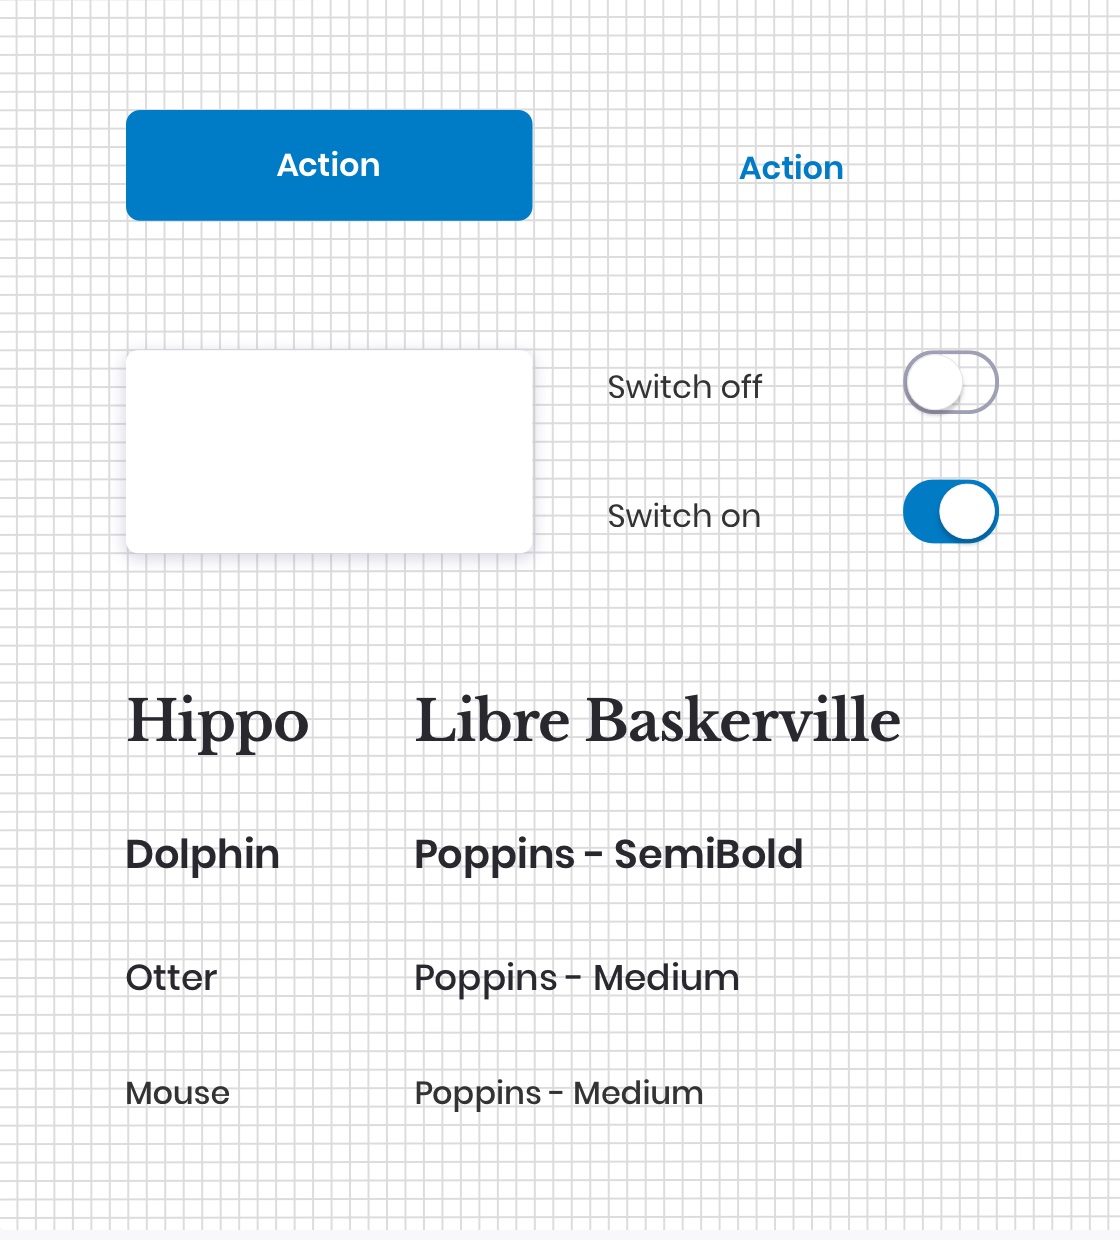
We made use of:
To speed things up, we assigned different tasks to each team member.
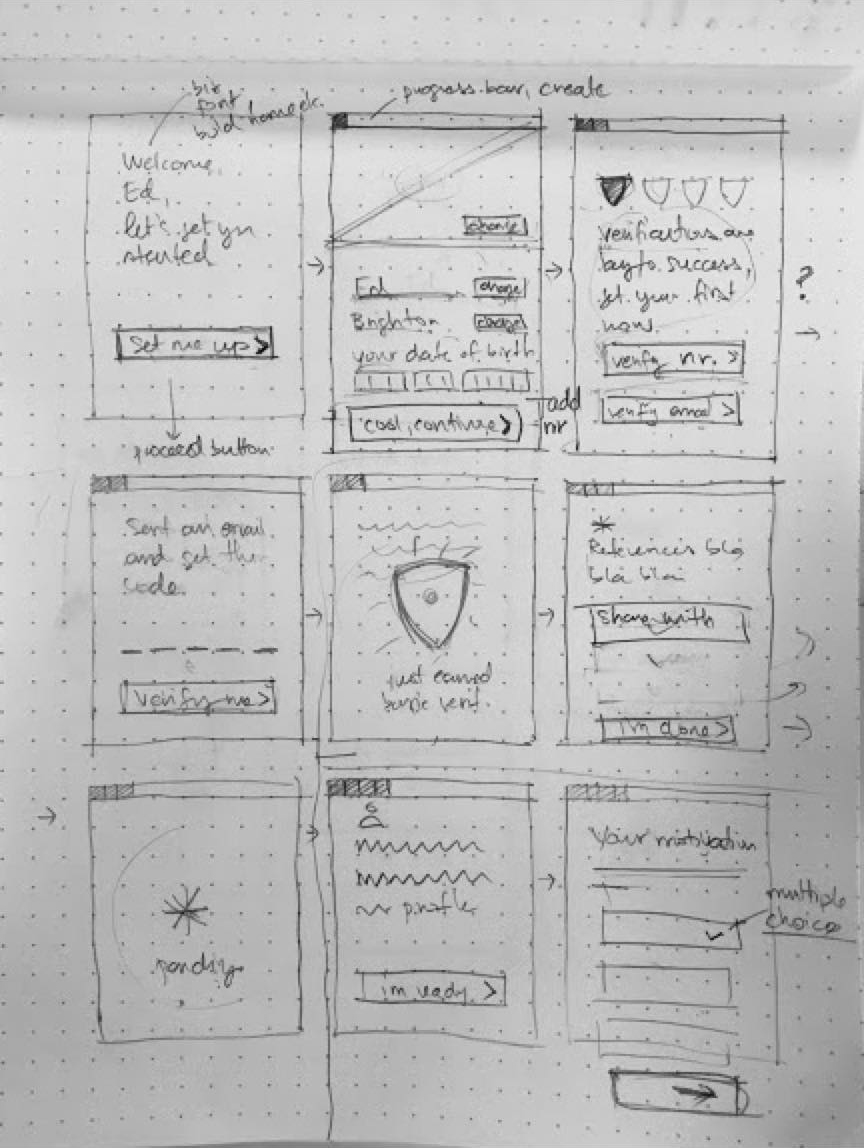
As the makers, myself and Tjasa sketched out specific details to help us prototype the storyboard.
Using our Design System and pattern library we rapidly created the screens in Sketch then turned them into an interactive prototype using inVision.
Ed, our stitcher, ran through the prototype narrating the journey as we checked against the storyboard to ensure we hadn't missed anything. This allowed us to iron out any issues before putting the prototype in front of our users the next day.
At the end of the day we had:
We set up two rooms, one for the usability testing/interviews and one for note-taking.
As the inVision prototype was designed for iPhone, we set up mobile device screen sharing and a webcam to view the users' reactions when running through the test script.
We hosted six users to test the prototype. The format looked something like this:
In the other room, team members wrote notes on observations, quotes, and interpretations of what happened. These were taken on sticky notes and distributed to a whiteboard.
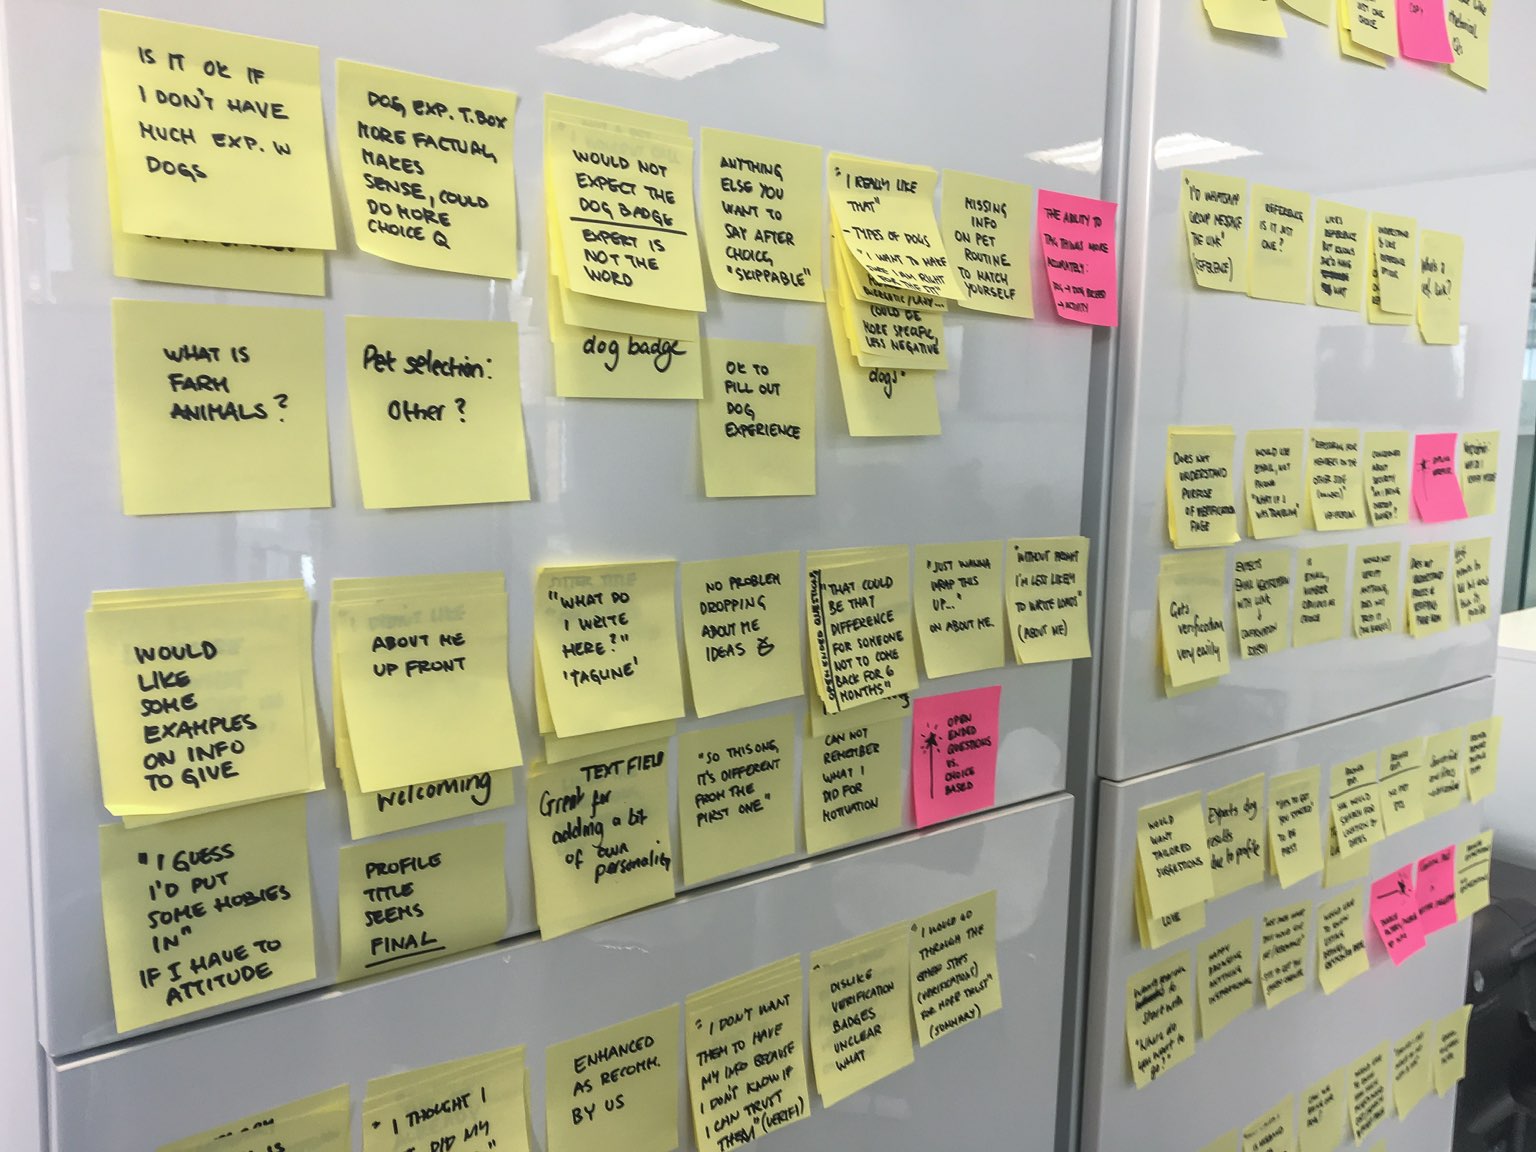
After completing the interviews, the entire team silently reviewed the sticky notes then made notes on observed patterns.
We continued to iterate the designs based on the observed patterns and validated new ideas using remote user testing. Results have been very positive with users so far as we have ironed out most issues highlighted form the sprint testing phase.
Overall, pet sitter success and retention have increased.